

When you share data-driven content – one that includes real numbers or statistics – you set yourself apart. You’re not just saying something because it “feels right.” You’re showing proof. It’s a great way to build authority.
For consultants and coaches, this is powerful. Clients want to work with experts who have insight. Having data to back up your claims shows that you’ve studied the landscape and can back your advice with facts. It builds trust. It positions you as an authority. And it makes your audience come back for more.
Think about it. If you read two articles on leadership—one with excellent but generic tips, and one that says, “Based on responses from 50 leaders, 73% struggle most with delegation”—which one feels more credible?
That’s the advantage of data-driven content.
Creating this kind of content starts with having the right source of data. You could use public reports, but that doesn’t make your insights unique. Instead, you can easily collect your own data and share it in ways that matter to your clients.
Here are practical ways to do it:
Instead of waiting for someone else’s study, create your own. Build an assessment that measures something your clients care about.
If you’re a leadership coach, you might measure decision-making styles. (use a wheel of life or personality assessments and quizzes)
If you’re a marketing consultant, you might measure digital readiness. (here’s a sample digital maturity model)
When participants complete the assessment, they get instant feedback. You get the aggregated data. That’s a great incentive – a lead magnet.
This kind of statistic shows a direct link between a skill gap and a business outcome—perfect for a coaching newsletter or LinkedIn post.
Run your assessment for a set period—say three months—and publish a report. For example:
“The 2025 Leadership Readiness Report: Insights from 300 Executives Across North America”
Include charts, patterns, and commentary. Explain what the data means and what actions people can take. These reports work well annually or quarterly.
The insight here? Many organizations are racing toward AI without building the foundational capabilities to support it—an excellent talking point for a technology consultant.
If your assessment runs continuously, share trends as new responses come in. A short monthly post could say:
“In July, leaders scored an average of 62% in strategic clarity, a drop from June’s 67%. Here’s what we think is happening…”
Clients will appreciate that you’re keeping a pulse on the market.
This kind of timely observation can fuel client conversations about adapting change strategies for different work environments.
Look for patterns across different parts of your assessment. For example:
“80% of respondents who scored low on loyalty metrics also scored low on analytics maturity.”
This adds depth to your insights. You’re not just reporting numbers—you’re finding connections that others miss.
A short stat like this can spark meaningful discussions in workshops or articles about the value of emotional intelligence.
Don’t just publish the data once and forget it. Use it in your email campaigns, webinars, and client conversations.
A coaching newsletter could feature “Statistic of the Month” with commentary.
A consultant’s LinkedIn post could share a quick chart and ask for comments.
This keeps your data alive and in front of your audience.
You might be wondering: why not just run a survey?
Surveys have work for ever, but they often have a drawback – respondents don’t always get immediate value from filling them out. They answer questions and wait for a summary later, which may or may not interest them.
Assessments are different. Here’s why they’re more engaging:
Immediate value for participants
When someone takes an assessment, they get instant feedback. This could be a score, a rating, or a short report. They see where they stand right away. This is also a powerful lead magnet.
Curiosity drives completion
People want to know their results. That’s why they finish the assessment. They also compare themselves to others, which keeps them interested in future updates.
Better quality responses
Because participants know they’ll get insights, they tend to answer more honestly and thoughtfully. There is also email validation built in to enable this.
Built-in lead nurturing
If your assessment is part of your client onboarding or marketing, it naturally opens the door for follow-up conversations. You can discuss the results and offer solutions.
For coaches and consultants, that’s gold. You’re turning a one-time interaction into an ongoing dialogue.
Make data-driven content part of your business rhythm. It doesn’t have to be a complex project. With the right setup, you can publish fresh, credible insights that keep you top of mind with prospects and deepen trust with existing clients.
If you’re ready to try this, you don’t need to start from scratch. Evalinator makes it easy to:
You can also integrate the results into your CRM or marketing automation platform. You can also set goals with promising prospects and clients based on their scores, so the conversation keeps moving forward.
When you combine your expertise with solid data, you stop being “just another expert”. You build trust and stay top-of-mind.

Feeling frustrated with lead generation?
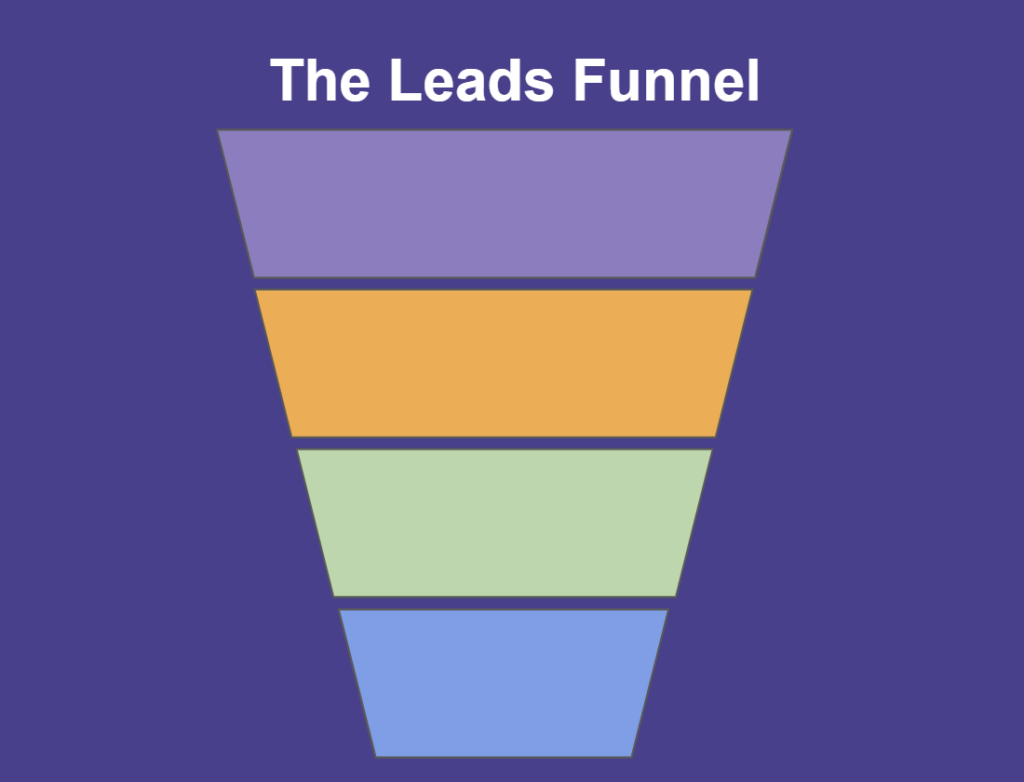
Take this free, 5-minute quiz and get more prospects into your leads funnel.
Instant Results. Actionable recommendations. Email required.
Find Your Score >>