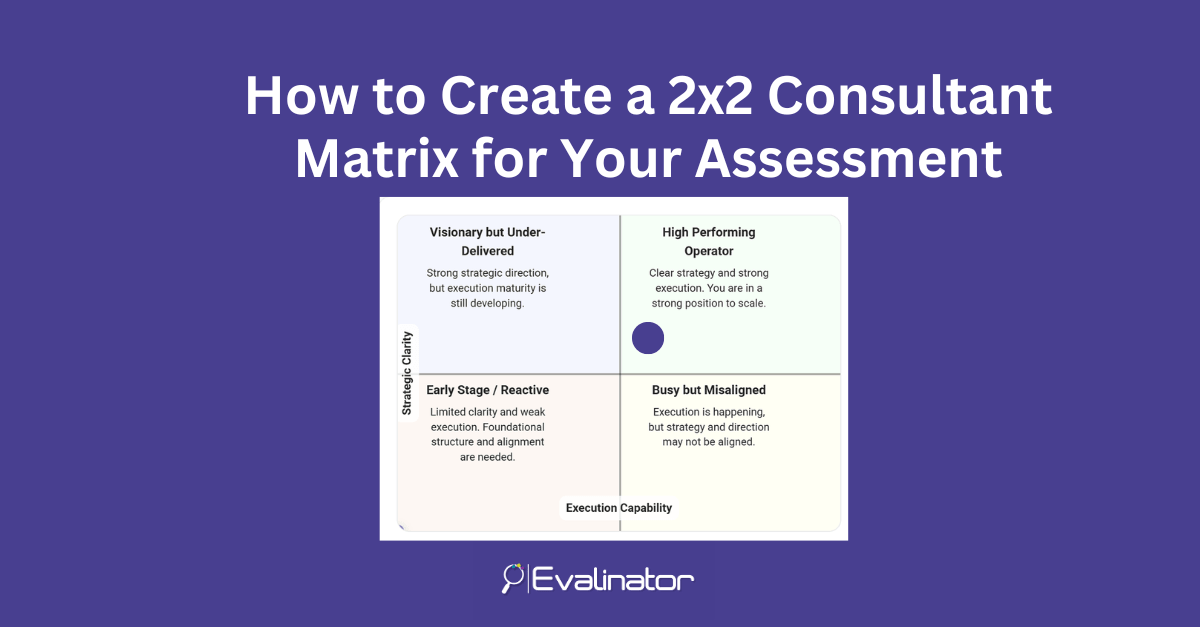
A 2×2 consultant matrix is a popular tool to convey a story. Just like a maturity model, the 2×2 matrix is a simple and effective way to turn assessment results into something clients instantly understand.
Instead of overwhelming them with raw scores or charts, you give them a clear visual: where they are today, and what that means.
In this post, you’ll learn how to create a 2×2 matrix for your consulting assessments using Evalinator—without rebuilding your assessment from scratch. You can simply add a new section, configure it, and publish.
Consultants often need to communicate results quickly and clearly. A 2×2 matrix does exactly that because it:
Clients may not remember every question score—but they will remember which quadrant they landed in.
A chart is useful when you want to show multiple independent scores (for example, Process = 72, Governance = 61, Technology = 80).
But a 2×2 consultant matrix compares two dimensions at the same time.
Instead of showing separate scores, a 2×2 consultant matrix combines them into one visual decision point.
For example:
A client can immediately see if they’re:
It creates a narrative, not just data.
With a bar chart, you still have to interpret what the numbers mean.
With a 2×2, interpretation is built in—because each quadrant can represent a consulting “story” such as:
That’s why the 2×2 consultant matrix is often more persuasive than traditional reporting charts.
Evalinator makes it easy to add a 2×2 matrix to your existing assessments. Once enabled, it automatically generates the matrix results section in your report.
Below are the steps to configure it. (You can add screenshots for each step.)
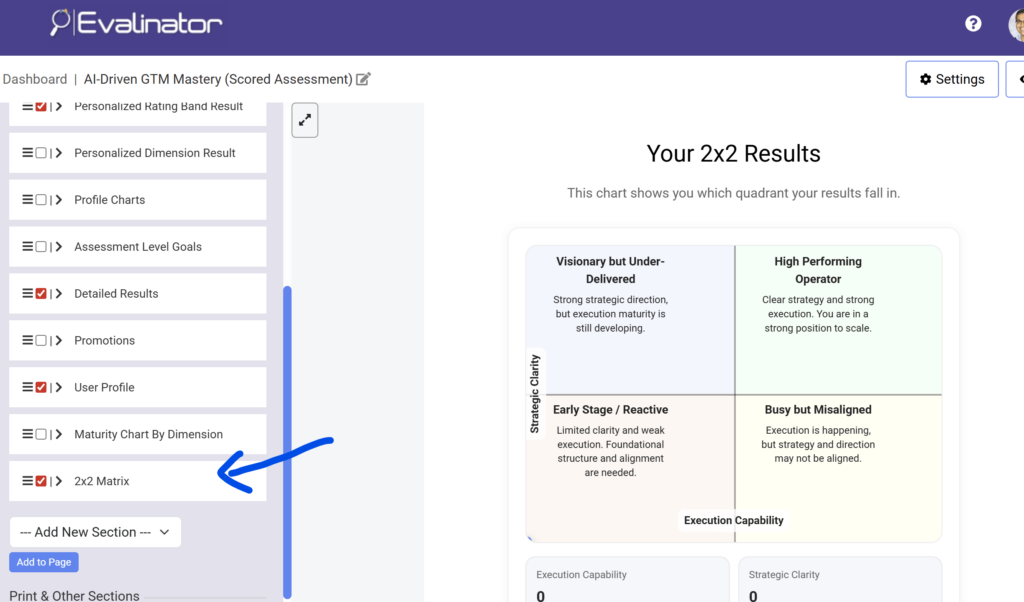
Go to your assessment builder, and under the Results section on the left, and enable the 2×2 Matrix section.
Once enabled, the matrix will appear in your results output automatically with default values.
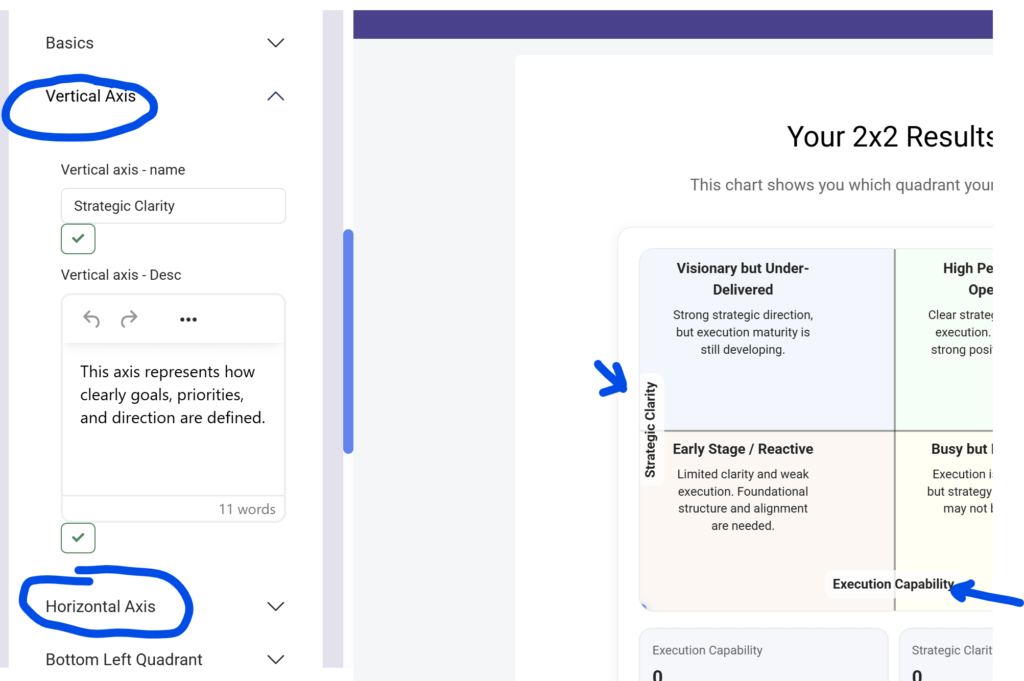
Define what the two axes represent.
Examples of common consultant axes:
Your axes should represent the two dimensions your client needs to understand most.
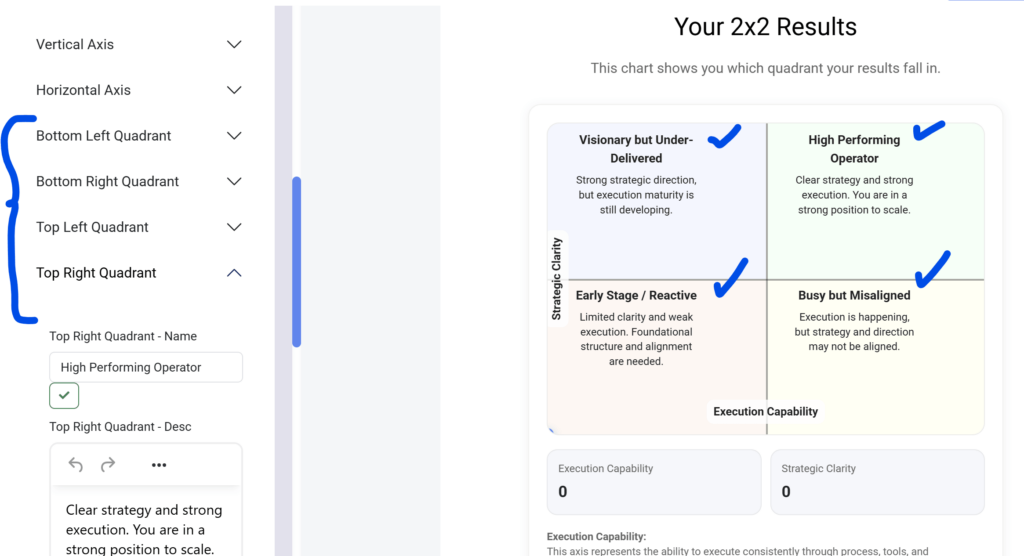
This is where your matrix becomes powerful.
Each quadrant should have:
Think of each quadrant as a mini-consulting recommendation.
For example:
Color matters more than people think.
Evalinator allows you to set quadrant colors so your results feel more like a professional consulting report.
You can use:
This makes your 2×2 consultant matrix look polished and presentation-ready.
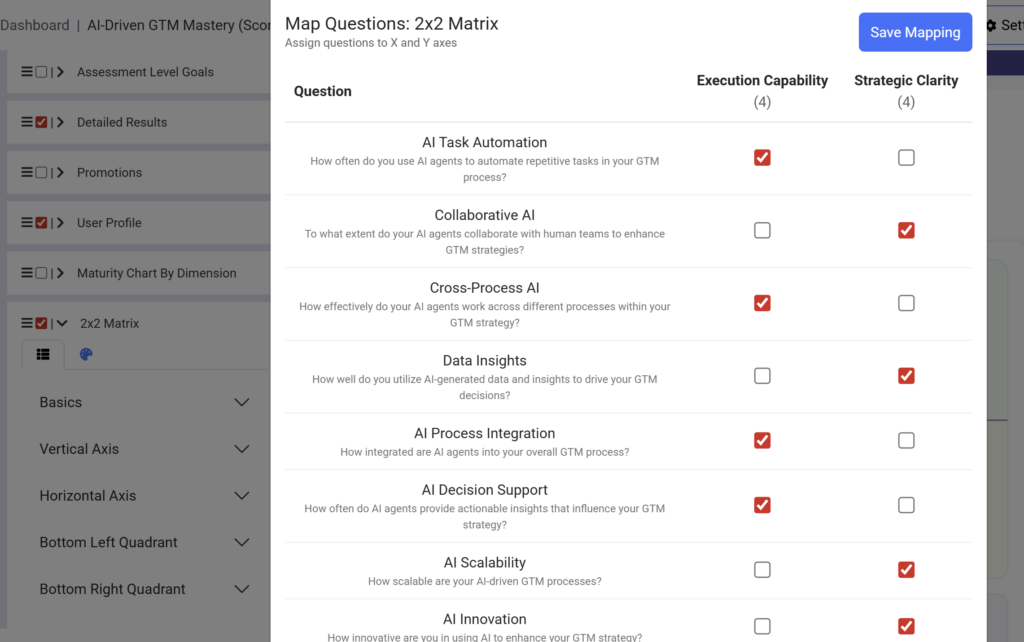
This is the step that connects your assessment data to the matrix.
Evalinator lets you choose which questions contribute to:
You simply check the questions that should influence each axis.
Example:
Evalinator then calculates the final X and Y scores and plots the client’s position automatically.
Once configured, your results report will automatically include:
The output is designed to be easy to interpret and easy to present.
The biggest benefit is that it gives you a framework to lead the conversation.
Instead of walking through 40 questions, you can start with:
“Here’s where you are today, and here’s what that means.”
A 2×2 consultant matrix also makes it easier to:
It turns assessment results into consulting outcomes.
If you already have assessments built, you don’t need to recreate anything.
With Evalinator, you can simply enable the matrix section, configure your axes and quadrants, map your questions, and publish.
The 2×2 consultant matrix feature gives you an instant “consulting-ready” results format that looks professional and makes your recommendations clearer.
If you want to try it out, sign up for Evalinator’s 2-week no-risk trial and build your first matrix-based assessment report today.
Feeling frustrated with lead generation?
Take this free, 5-minute quiz and get more prospects into your leads funnel.
Instant Results. Actionable recommendations. Email required.
Find Your Score >>