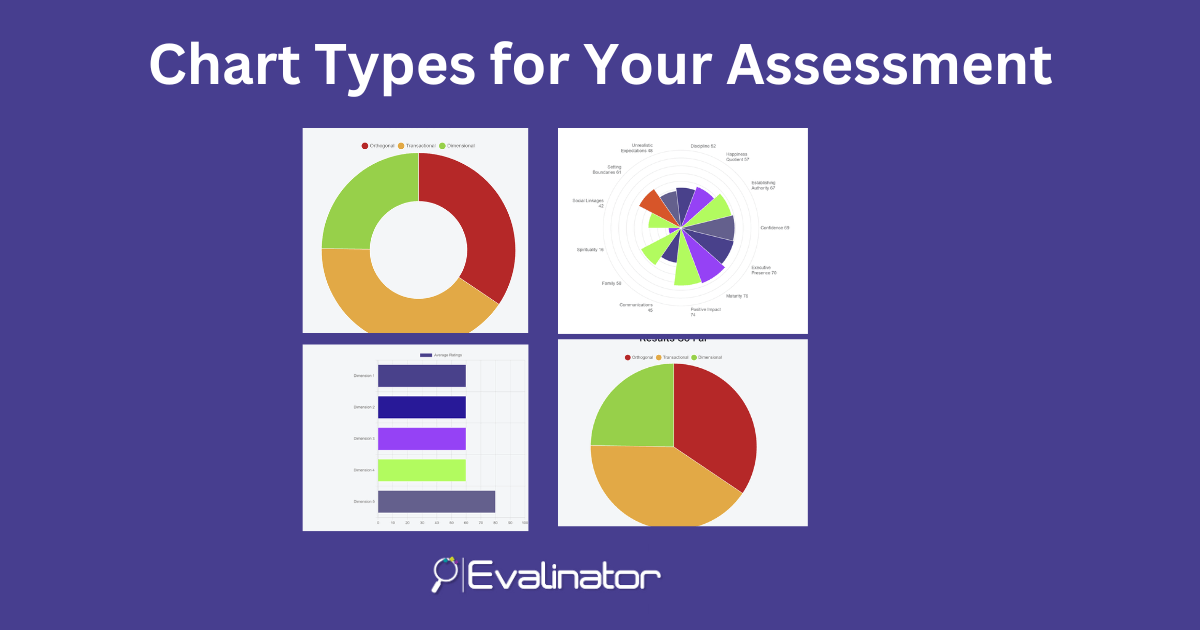
Every assessment or quiz needs a different chart type to convey its results.
That’s why Evalinator offers multiple chart options.
Let’s review the types of charts first.
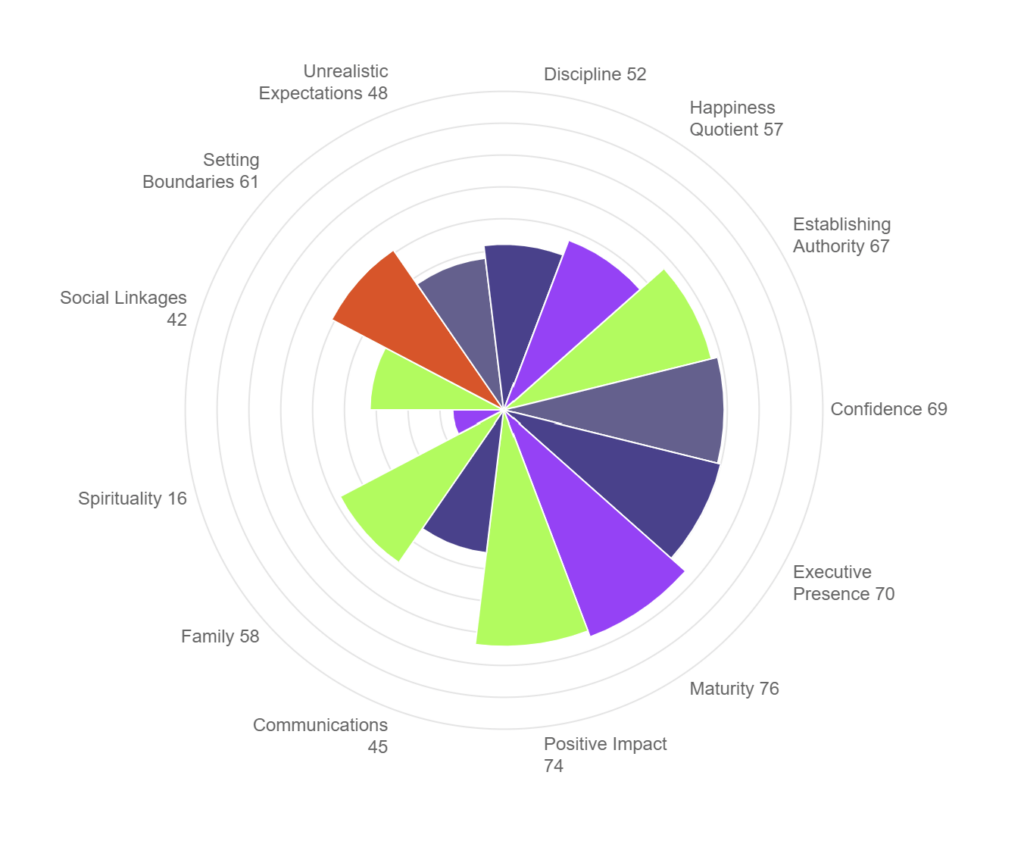
This pretty chart is often used to display a Wheel of Life. Each arm of the wheel can be a different color.
This chart can be universally used but is more associated for coaches who handle emotional and intangible aspects.
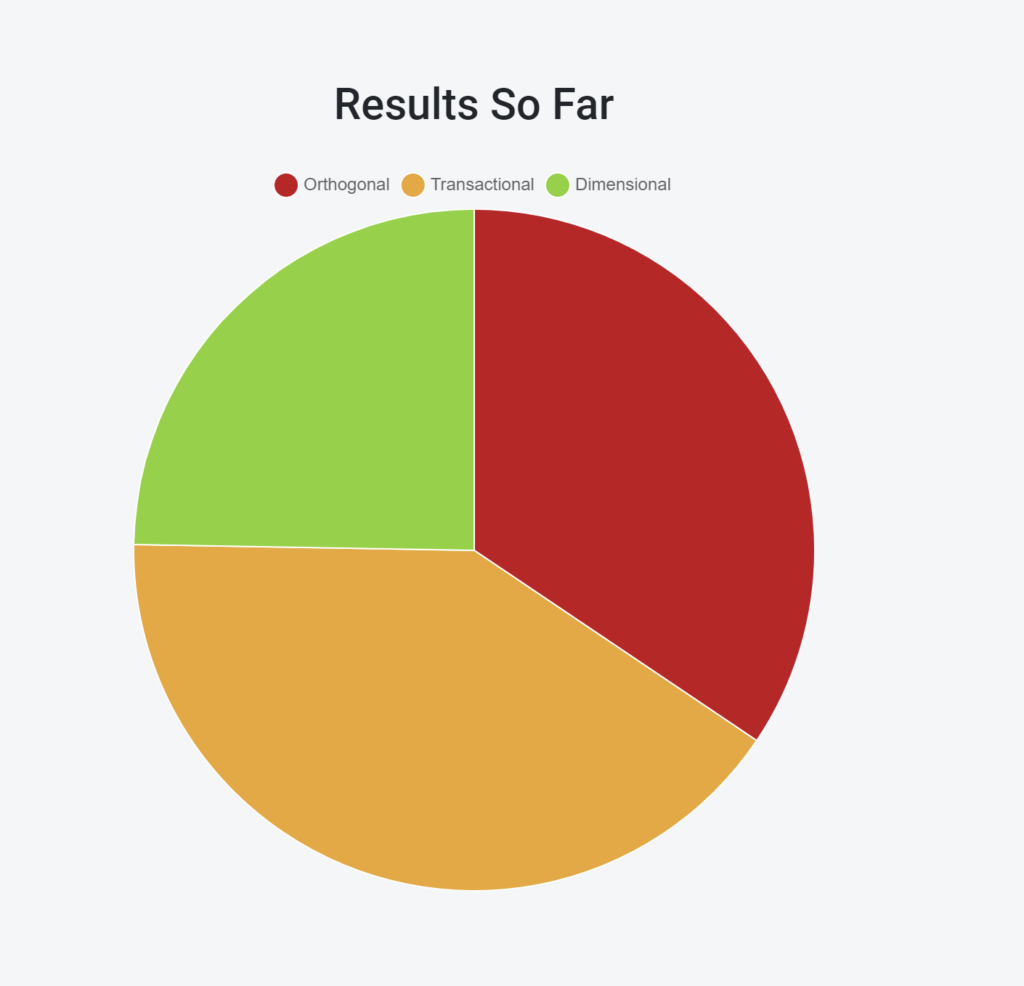
This type of chart is used to depict proportion. This is also universal and is used more for display of research (e.g. % of demographics) or authority data.
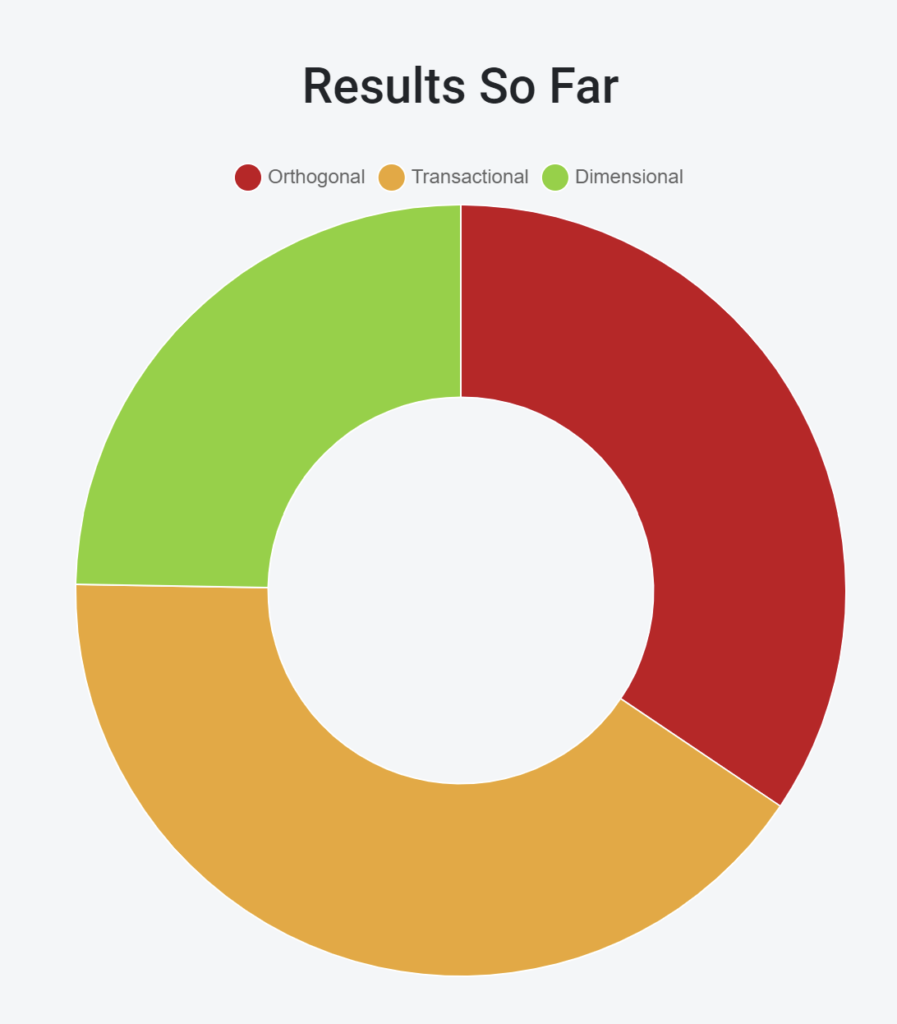
This chart is very similar to the Pie chart and is also used to depict proportion. The only difference is that the center is cut out. This additional space allows you to show another dataset (or ring of data). For example, you can show the current ratings in 5 categories in the outer ring, and the historical averages in the inner ring.
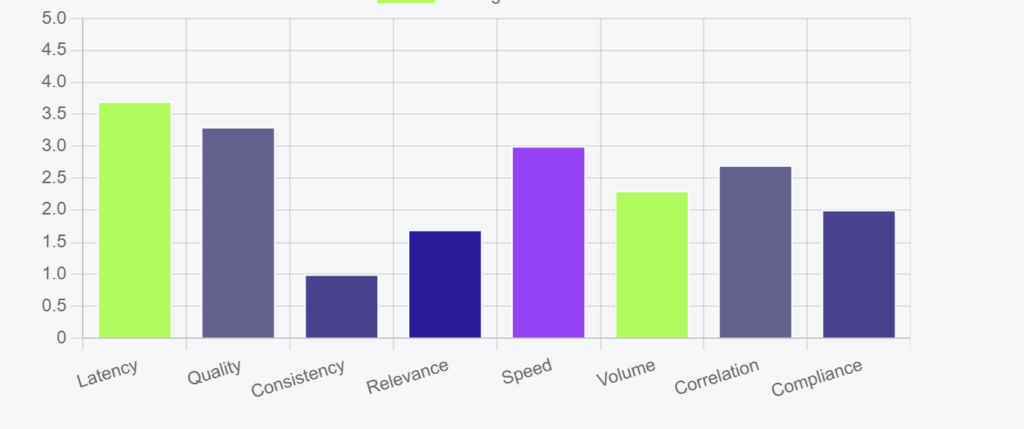
The bar chart is a very versatile chart and is used to display multiple scores for each type. For example, for each entry on the X-axis, you may display actual ratings, highest rating, average rating, and low rating.
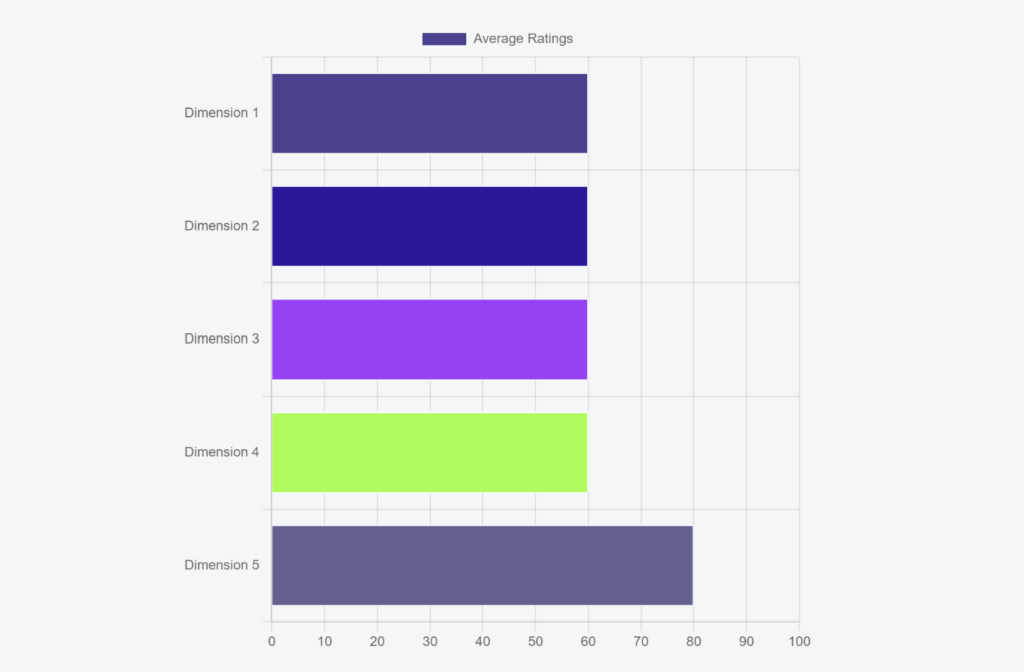
This chart is most useful to show quick comparisons between ratings. While this chart can also be used to display multiple scores for each type, typically, it is better used for 1 or 2 scores per entry.
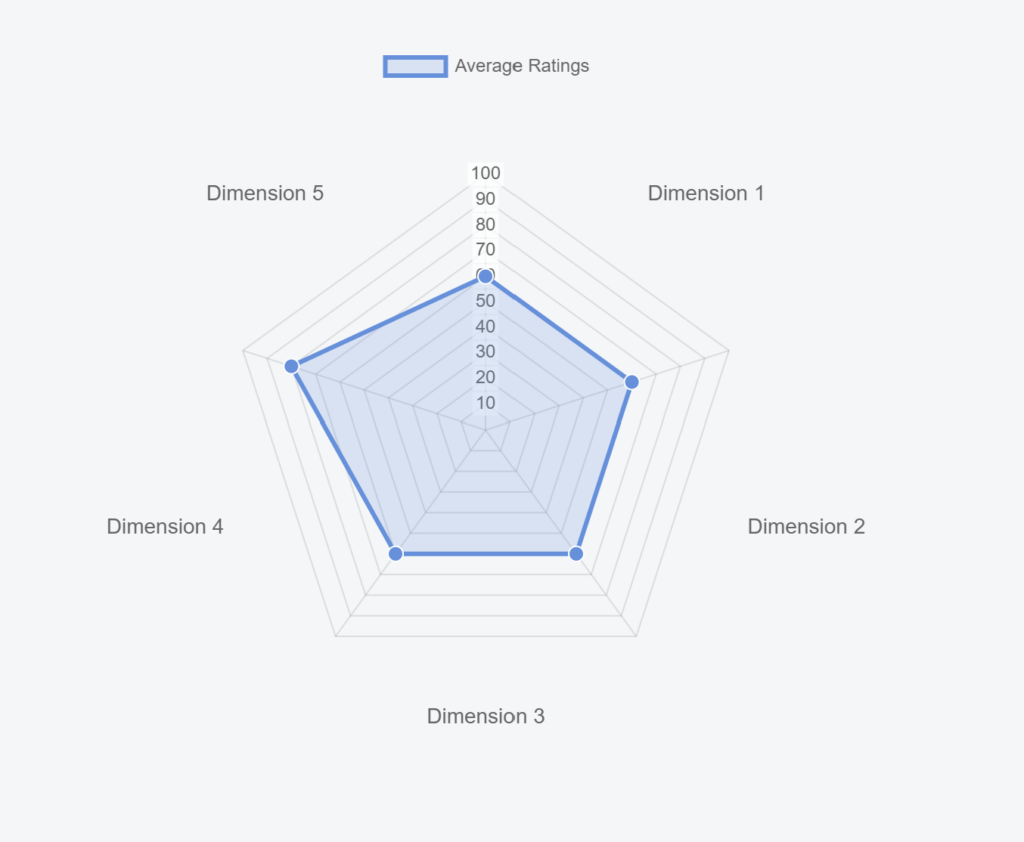
The radar or spider chart is a good display for ratings that are related to each other. For example, you may want to show results across 5 dimensions. Also, this type of chart is ideal for 5 dimensions or higher. Any lower than that, and the chart loses it’s visual appeal.
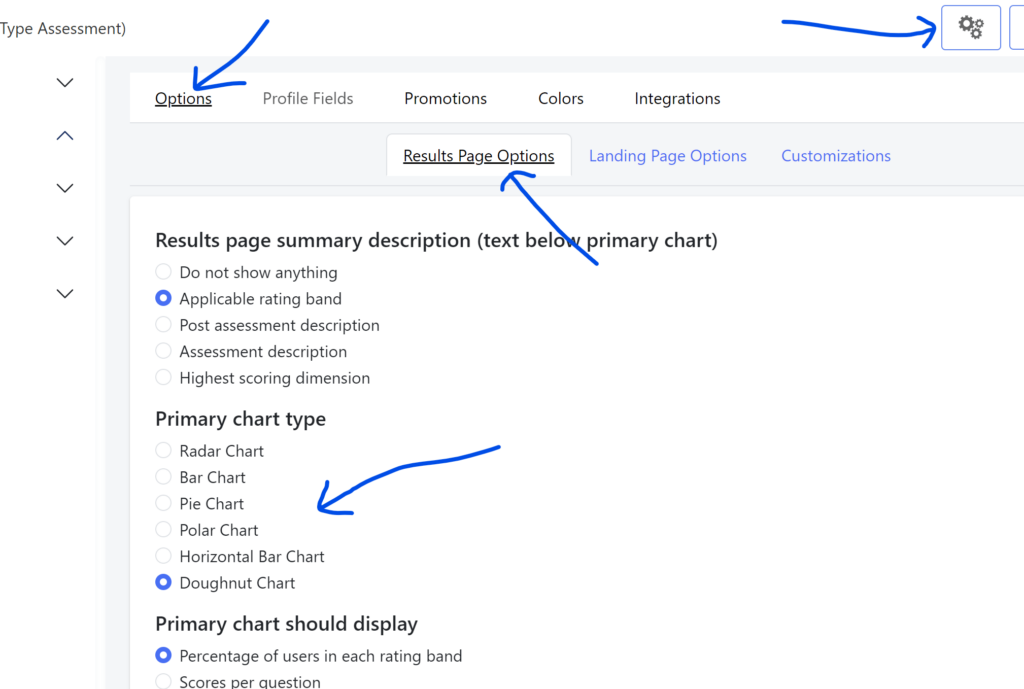
Selecting your chart type is easy and flexible.
Head on over to the Options section, and there you can select the following
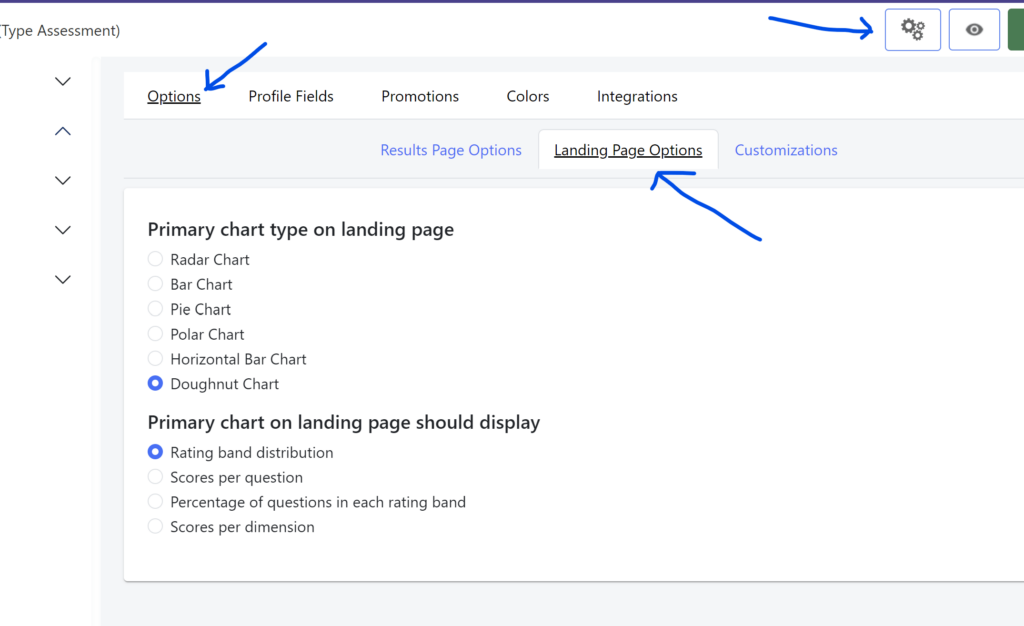
Evalinator allows you to show a live chart of average results so far on your landing page.
You can select the chart type from the Landing Page Options tab.
If you are looking to create an assessment, then we have a 2 week risk free trial. Please go ahead and sign up!
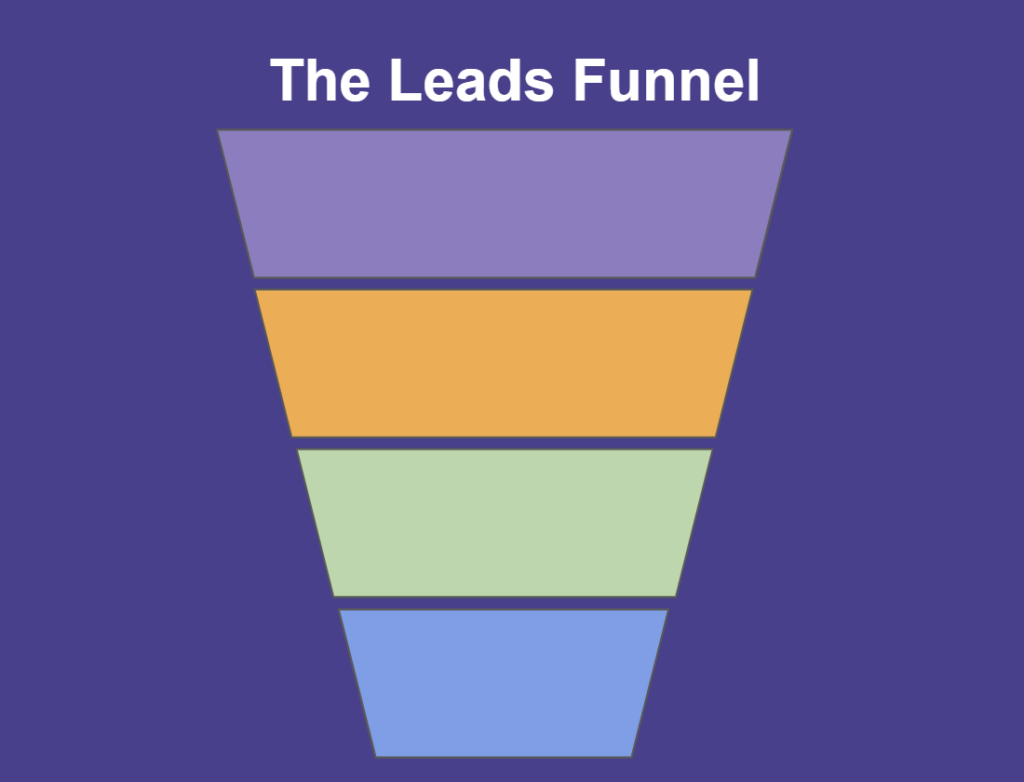
Feeling frustrated with lead generation?
Take this free, 5-minute quiz and get more prospects into your leads funnel.
Instant Results. Actionable recommendations. Email required.
Find Your Score >>